Introduction
At AnsibleFest 2022, we announced a new addition to the content ecosystem offered through Red Hat Ansible Automation Platform: Ansible validated content. Ansible validated content is use case-focused and provides an expert-guided path for performing operational tasks.
While Red Hat Ansible Certified Content Collections focus on how to integrate platforms (typically in the form of modules), Ansible validated content offers expert best practices and guidance for how to perform operations or tasks (typically in the form of roles or playbooks). Some Ansible validated content may depend on certified content (modules) for integration.
Specifically in the network automation area, we have already seen the release of network.base and network.bgp validated content.
Network engineers commonly ask about automation for network interfaces, which are the fundamental connection point for endpoints as layer 2 access ports, or other networking devices that extend the network to other domains as layer 3 interfaces. However it is extremely challenging to be able to collect data at scale and at the same time standardize settings for interfaces following specific rules through automation.
For this reason, we want to introduce you to the new network.interfaces collection. In this blog, we will show how you can automate network interfaces use cases with this new network validated content.
Network interfaces use cases
The network.interfaces validated content acts as an entry point for managing interface-related resources including an interface general state and configuration, and depending on the interface type, the specific configuration attributes for layer 2 interfaces such as switchport settings, or layer 3 interfaces such as IP addresses. This Collection also enables users to perform interface health checks, and is designed to be platform-agnostic. It provides a consistent user experience across different network platforms. It includes the following capabilities:
- Build Brownfield Inventory: The `persist` operation enables users to be able to get the facts for a network interface resource and store it as host_vars. The idea is to have this dynamic inventory as a single source of truth for a given operation.
- Display Structured Configuration: The `gather` operation enables users to be able to gather and display the facts for network interfaces resources.
- Deploy Changes: The `deploy` operation enables users to deploy the host vars facts changes to the device. You should be aware that there is also another way of pushing configurations onto the device through the `configure` operation.
- Detecting network configuration drift: The newly introduced `detect` operation enables users to detect configuration drift in interfaces configuration of network devices.
- Rectifying network configuration drift: The `remediate` operation enables users to remediate configuration drift in the interfaces configuration of network devices.
- INTERFACES health check: The `health_check` operation enables users to fetch the operational and admin status of INTERFACES for a given network OS.
Using the persist operation – Building Brownfield Inventory with Persist
Let’s look at an example. The `persist` operation enables users to be able to get the interfaces, l2 interfaces, l3 interfaces running configuration facts and store them as host vars.
Result of successful persist operation would be host_vars having YAML formatted interface facts.
These host_vars could exist locally or even published to remote repositories acting as SOT for operations like deploy, remediate, detect, etc.
This is the native command output for the interfaces summary on one Cisco IOS XR router:
RP/0/RP0/CPU0:10#show interfaces
Tue Apr 18 09:47:14.890 UTC
Null0 is up, line protocol is up
  Interface state transitions: 1
  Hardware is Null interface
  Internet address is Unknown
  MTU 1500 bytes, BW 0 Kbit
     reliability 255/255, txload Unknown, rxload Unknown
  Encapsulation Null,  loopback not set,
  Last link flapped 4w6d
  Last input never, output never
  Last clearing of "show interface" counters never
  5 minute input rate 0 bits/sec, 0 packets/sec
  5 minute output rate 0 bits/sec, 0 packets/sec
     0 packets input, 0 bytes, 0 total input drops
     0 drops for unrecognized upper-level protocol
     Received 0 broadcast packets, 0 multicast packets
     0 packets output, 0 bytes, 0 total output drops
     Output 0 broadcast packets, 0 multicast packets

MgmtEth0/RP0/CPU0/0 is up, line protocol is up
  Interface state transitions: 1
  Hardware is Management Ethernet, address is fa16.3e36.6b20 (bia fa16.3e36.6b20)
  Internet address is 10.0.150.115/22
  MTU 1514 bytes, BW 0 Kbit
     reliability 255/255, txload Unknown, rxload Unknown
  Encapsulation ARPA,
  Duplex unknown, 0Kb/s, CX, link type is autonegotiation
  loopback not set,
  Last link flapped 4w6d
  ARP type ARPA, ARP timeout 04:00:00
  Last input 00:00:00, output 00:00:00
  Last clearing of "show interface" counters never
  5 minute input rate 2000 bits/sec, 5 packets/sec
  5 minute output rate 0 bits/sec, 0 packets/sec
     13238720 packets input, 752085409 bytes, 0 total input drops
     0 drops for unrecognized upper-level protocol
     Received 13200294 broadcast packets, 4 multicast packets
              0 runts, 0 giants, 0 throttles, 0 parity
     0 input errors, 0 CRC, 0 frame, 0 overrun, 0 ignored, 0 abort
     53140 packets output, 4101618 bytes, 0 total output drops
     Output 0 broadcast packets, 0 multicast packets
     0 output errors, 0 underruns, 0 applique, 0 resets
     0 output buffer failures, 0 output buffers swapped out
     1 carrier transitions

GigabitEthernet0/0/0/0 is up, line protocol is up
  Interface state transitions: 1
  Hardware is GigabitEthernet, address is fa16.3ed5.a906 (bia fa16.3ed5.a906)
  Description: this is interface0
  Internet address is 198.51.100.1/24
  MTU 1514 bytes, BW 1000000 Kbit (Max: 1000000 Kbit)
     reliability 255/255, txload 0/255, rxload 0/255
  Encapsulation ARPA,
  Duplex unknown, 1000Mb/s, link type is force-up
  output flow control is off, input flow control is off
  loopback not set,
  Last link flapped 4w6d
  ARP type ARPA, ARP timeout 04:00:00
  Last input 00:00:00, output 02:58:26
  Last clearing of "show interface" counters never
  5 minute input rate 2000 bits/sec, 5 packets/sec
  5 minute output rate 0 bits/sec, 0 packets/sec
     14617278 packets input, 820397009 bytes, 15149 total input drops
     0 drops for unrecognized upper-level protocol
     Received 7301060 broadcast packets, 0 multicast packets
              0 runts, 0 giants, 0 throttles, 0 parity
     0 input errors, 0 CRC, 0 frame, 0 overrun, 0 ignored, 0 abort
     2 packets output, 84 bytes, 0 total output drops
     Output 1 broadcast packets, 0 multicast packets
     0 output errors, 0 underruns, 0 applique, 0 resets
     0 output buffer failures, 0 output buffers swapped out
     0 carrier transitions

GigabitEthernet0/0/0/1 is up, line protocol is up
  Interface state transitions: 1
  Hardware is GigabitEthernet, address is fa16.3e58.e6e5 (bia fa16.3e58.e6e5)
  Description: this is interface1
  Layer 2 Transport Mode
  MTU 1514 bytes, BW 1000000 Kbit (Max: 1000000 Kbit)
     reliability 255/255, txload 0/255, rxload 0/255
  Encapsulation ARPA,
  Duplex unknown, 1000Mb/s, link type is force-up
  output flow control is off, input flow control is off
  loopback not set,
  Last link flapped 03:12:02
  Last input 00:00:00, output never
  Last clearing of "show interface" counters never
  5 minute input rate 2000 bits/sec, 4 packets/sec
  5 minute output rate 0 bits/sec, 0 packets/sec
     36798 packets input, 2737242 bytes, 27092 total input drops
     0 drops for unrecognized upper-level protocol
     Received 9110 broadcast packets, 0 multicast packets
              0 runts, 0 giants, 0 throttles, 0 parity
     0 input errors, 0 CRC, 0 frame, 0 overrun, 0 ignored, 0 abort
     0 packets output, 0 bytes, 0 total output drops
     Output 0 broadcast packets, 0 multicast packets
     0 output errors, 0 underruns, 0 applique, 0 resets
     0 output buffer failures, 0 output buffers swapped out
     0 carrier transitions
Fetch interfaces facts and builds local inventory host_vars
Let’s save these interfaces configuration as YAML based host_vars in the local data store. We can write a task as shown below:
- name: Enables users to create a brownfield inventory , with host-vars having the network resource facts.
 hosts: iosxr
 gather_facts: false
 tasks:
   - name: INTERFACES Manager
     ansible.builtin.include_role:
       name: network.interfaces.run
     vars:
       operations:
         - name: persist
       data_store:
               local: "~/backup/network"
Execute the Ansible Playbook with the ansible-navigator:
$ ansible-navigator run example.yaml -i inventory.yaml
Here is the new directory structure that was created:
$ cd ~/backup/network
$ tree host_vars
host_vars
└── 10.0.150.115
    ├── interfaces.yaml
    ├── l2_interfaces.yaml
    └── l3_interfaces.yaml
In the output, we can observe that this Ansible Playbook created files for non-empty results with names similar to resource module names. The content of these files are gathered facts for the resource modules as shown below:
$ cat backup/network/host_vars/10.0.150.115/interfaces.yaml
interfaces:
-   description: this is interface0
    enabled: true
    name: GigabitEthernet0/0/0/0
-   description: this is interface1
    enabled: false
    name: GigabitEthernet0/0/0/1
Fetch interfaces facts and publishes inventory host_vars to remote repositories
Let’s save these interfaces configuration as YAML based host_vars and publish it to a remote repository. We can write a task as shown below:
-- name: Enables users to create a brownfield inventory , with host-vars having the network resource facts.
 hosts: iosxr
 gather_facts: false
 tasks:
 - name: INTERFACES Manager
   ansible.builtin.include_role:
     name: network.interfaces.run
   vars:
     operations:
       - name: persist
     data_store:
             scm:
               origin:
                   url: "{{ your_github_repo }}"
                   token: "{{ github_access_token }}"
                   user:
                     name: "{{ ansible_github }}"
                     email: "{{ [email protected] }}"
Execute the Ansible Playbook with the ansible-navigator:
$ ansible-navigator run example.yaml -i inventory.yaml
Here is the new directory structure that was created on remote repository:
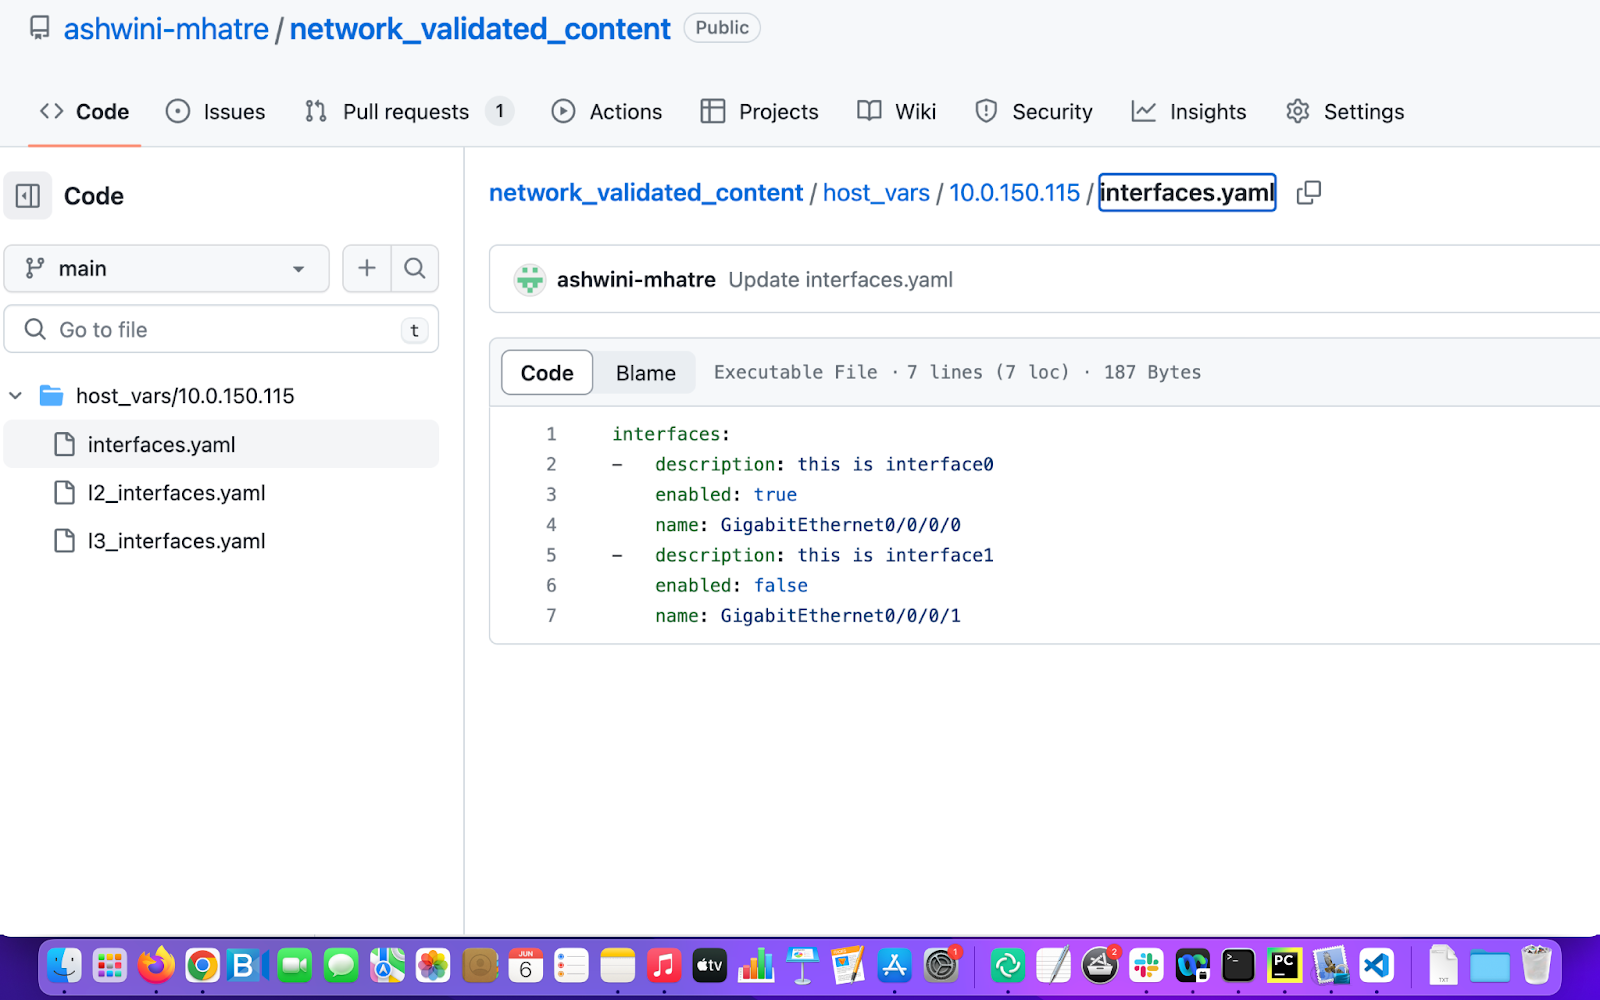
In the output, we can observe that this Ansible Playbook created files for non-empty results with names similar to resource module names. The content of these files are gathered facts for the resource modules as shown above in the repository.
Using the deploy operation – Deploy interfaces configuration
The `deploy` operation enables users to deploy the host_vars facts changes in dynamic inventory onto the network devices.
Let’s change “enabled” admin state of GigabitEthernet0/0/0/1 from “false” to “true” in the interfaces.yaml file as shown below:
$ cat backup/network/host_vars/10.0.150.115/interfaces.yaml
interfaces:
-   description: this is interface0
    enabled: true
    name: GigabitEthernet0/0/0/0
-   description: this is interface1
    enabled: true
    name: GigabitEthernet0/0/0/1
Now that we have modified the interfaces host_vars, we can use deploy operation as shown below using local data store:
---
- name: Enable users to read and deploy the facts from the brownfield inventory.
 hosts: iosxr
 gather_facts: false
 tasks:
 - name: INTERFACES Manager
   ansible.builtin.include_role:
     name: network.interfaces.run
   vars:
     operations:
       - name: deploy
      data_store:
        local: "~/backup/network"
Execute the Ansible Playbook with the ansible-navigator:
$ ansible-navigator run example.yaml
We can confirm these changes on the device with the show command as described below, notice the interface is now administratively down:
RP/0/RP0/CPU0:10#show running-config interface
Wed Apr 19 07:02:08.346 UTC
interface MgmtEth0/RP0/CPU0/0
 ipv4 address dhcp
!
interface GigabitEthernet0/0/0/0
 description this is interface0
 ipv4 address 198.51.100.1 255.255.255.0
!
interface GigabitEthernet0/0/0/1
 description this is interface1
 shutdown
 l2transport
  l2protocol cpsv tunnel
  propagate remote-status
 !
!
If you want to know more about the tasks executed internally, you can check out the result.
Note: We can also use the deploy operation using a remote data store similar to persist operation.
Using the gather operation – Display interfaces configuration
The `gather` operation enables users to gather and display the facts for interfaces, L2 interfaces and L3 interfaces resources as shown below:
---
- name: Enables users to perform the gathered state operation for the provided resources.
 hosts: iosxr
 gather_facts: false
 tasks:
 - name: INTERFACES Manager
   ansible.builtin.include_role:
     name: network.interfaces.run
   vars:
     operations:
       - name: gather
Execute the Ansible Playbook with the ansible-navigator:
$ ansible-navigator run example.yaml
Here is snippet from the output of the gather operation show below presenting the L3 interface details in a structured format:
…
TASK [network.base.resource_manager : Resource Facts] **********************************************************************
[WARNING]: Persistent connection logging is enabled for 10.0.150.115. This will log ALL interactions and WILL NOT redact
sensitive configuration like passwords. USE WITH CAUTION!
ok: [10.0.150.115] => {
    "msg": {
        "ansible_connection": "ansible.netcommon.network_cli",
        "ansible_network_os": "cisco.iosxr.iosxr",
        "changed": false,
        "failed": false,
        "gathered": [
            {
                "ipv4": [
                    {
                        "address": "198.51.100.1/24"
                    }
                ],
                "name": "GigabitEthernet0/0/0/0"
            },
            {
                "name": "GigabitEthernet0/0/0/1"
            }
        ],
        "resource_module_name": "cisco.iosxr.iosxr_l3_interfaces"
    }
}
…
Note that relevant data can be obtained in a structure format, which makes it simpler in the future to parse and manipulate. We can also see the detailed output here, which also includes L2 switchport interfaces examples.
Using the detect operation – Detect configuration drift
The `detect` operation is used to detect configuration drift in network infrastructure. It will read the facts from the local or remote data store and detect if any configuration changes are there on the interfaces. For example, let’s make some interface configuration changes on the Cisco IOS XR device. Let’s update the admin status of the interface to `shutdown`.
Here we have updated the status of interface GigabitEthernet0/0/0/1.
RP/0/RP0/CPU0:10#show running-config interface
Wed Apr 19 12:19:15.708 UTC
interface MgmtEth0/RP0/CPU0/0
 ipv4 address dhcp
!
interface GigabitEthernet0/0/0/0
 description this is interface0
 ipv4 address 198.51.100.1 255.255.255.0
!
interface GigabitEthernet0/0/0/1
 description this is interface1
 shutdown
 l2transport
  l2protocol cpsv tunnel
  propagate remote-status
 !
!
The detect task can be shown as below:
---
- name: Enable users to detect configuration drift in network infrastructure.
 hosts: iosxr
 gather_facts: false
 tasks:
 - name: INTERFACES Manager
   ansible.builtin.include_role:
     name: network.interfaces.run
   vars:
     operations:
       - name: detect
     data_store:
               local: "~/backup/network"
Execute the Ansible Playbook with the ansible-navigator:
$ ansible-navigator run example.yaml
Here is snippet from the output of the detect operation:
fatal: [10.0.150.115]: FAILED! => {
    "changed": false,
    "msg": "configuration drift is found in cisco.iosxr.iosxr_interfaces Resource"
}
We can also see the detailed output here.
Note: We can also use detect operation using a remote data store similar to the persist operation.
Using the remediate operation – Remediate configuration drift
The `remediate` operation will read the facts from the local or remote data store and remediate if there are any configuration changes on the networking devices. This is done by overriding the running configuration with read facts from the local or remote data store.
For example, the last time we enabled shutdown on the interface for the detect operation and made changes in the configuration. Now, we can actually use the remediate operation to rectify this configuration drift.
----
- name: Restore config in network.
 hosts: iosxr
 gather_facts: false
 tasks:
 - name: INTERFACES Manager
   ansible.builtin.include_role:
     name: network.interfaces.run
   vars:
     operations:
       - name: remediate
     data_store:
               local: "~/backup/network"
Execute the Ansible Playbook with the ansible-navigator:
$ ansible-navigator run example.yaml
Here is snippet from the output of the remediate operation:
changed: [10.0.150.115] => {
    "after": [
        {
            "description": "this is interface0",
            "enabled": true,
            "name": "GigabitEthernet0/0/0/0"
        },
        {
            "description": "this is interface1",
            "enabled": true,
            "name": "GigabitEthernet0/0/0/1"
        }
    ],
    "ansible_connection": "ansible.netcommon.network_cli",
    "ansible_network_os": "cisco.iosxr.iosxr",
    "before": [
        {
            "description": "this is interface0",
            "enabled": true,
            "name": "GigabitEthernet0/0/0/0"
        },
        {
            "description": "this is interface1",
            "enabled": false,
            "name": "GigabitEthernet0/0/0/1"
        }
    ],
    "changed": true,
    "commands": [
        "interface GigabitEthernet0/0/0/1",
        "no shutdown"
    ],
    "invocation": {
        "module_args": {
            "config": [
                {
                    "description": "this is interface0",
                    "duplex": null,
                    "enabled": true,
                    "mtu": null,
                    "name": "GigabitEthernet0/0/0/0",
                    "speed": null
                },
                {
                    "description": "this is interface1",
                    "duplex": null,
                    "enabled": true,
                    "mtu": null,
                    "name": "GigabitEthernet0/0/0/1",
                    "speed": null
                }
            ],
            "running_config": null,
            "state": "overridden"
        }
    },
    "resource_module_name": "cisco.iosxr.iosxr_interfaces"
}

TASK [network.base.resource_manager : Apply configuration] *********************
task path:
We can also see the detailed output here.
Using the health_check operation – Run Health Checks
The `health_check` operation enables users to perform health checks for the interfaces resource. These health checks should be able to provide the interface’s admin and operational state with necessary details.
- all_operational_state_up: This health-check returns `successful` only when all the interfaces are operationally up.
- all_admin_state_up: This health-check returns `successful` only when all the interfaces are administratively up.
- min_operational_state_up: This health-check takes `min_count` as input and returns `successful` only when the minimum number of interfaces are operationally up.
- min_admin_state_up:This health-check takes `min_count` as input and returns `successful` only when the minimum number of interfaces are administratively up.
While using the `health_check` operation, we can make use of the `detail` flag to get more information about the interfaces status. We can also use the `ignore_errors` flag to ignore the `unsuccessful` result of the health_check operation.
- Detail: This flag provides a detailed INTERFACES status summary.
- Ignore_errors: This flag ignores any errors while fetching the health_check result.
Here is an Ansible Playbook example of using operation: health_check with all_operational_state_up check and displaying the result:
---
- name: Perform interfaces health checks
 hosts: iosxr
 gather_facts: false
 tasks:
 - name: INTERFACES Manager
   ansible.builtin.include_role:
     name: network.interfaces.run
   vars:
     operations:
       - name: health_check
         vars:
           details: False
           checks:
             - name: all_operational_state_up
Execute the Ansible Playbook with the ansible-navigator.
$ ansible-navigator run example.yaml
Here is the provided result:
ok: [10.0.150.115] => {
    "failed_when_result": false,
    "health_checks": {
        "all_operational_state_up": {
            "check_status": "successful",
            "interfaces_status_summery": {
                "admin_down": 4,
                "admin_up": 1,
                "down": 0,
                "total": 5,
                "up": 5
            }
        },
        "status": "successful"
    }
}

…
Here as we have used `all_operational_state_up` health_check and all the interfaces are operationally `UP`, the check_status value is “successful“.
We can also perform a health-check where we want some minimum number of interfaces administratively `UP` with min_admin_state_up check and displaying the result:
---
- name: Perform interfaces health checks
 hosts: iosxr
 gather_facts: false
 tasks:
 - name: INTERFACES Manager
   ansible.builtin.include_role:
     name: network.interfaces.run
   vars:
     operations:
       - name: health_check
         vars:
           details: False
           checks:
             - name: min_admin_state_up
               Min_count:  2
Execute the Ansible Playbook with the ansible-navigator:
$ ansible-navigator run example.yaml
Here is the provided result:
fatal: [10.0.150.115]: FAILED! => {
    "failed_when_result": true,
    "health_checks": {
        "min_admin_state_up": {
            "check_status": "unsuccessful",
            "interfaces_status_summery": {
                "admin_down": 4,
                "admin_up": 1,
                "down": 0,
                "total": 5,
                "up": 5
            }
        },
        "status": "unsuccessful"
    }
}

…
Please note that the performed health `min_admin_state_up` has failed. The reason it failed is because there was only one interface administratively up and we have given min_count as 2.
We can also perform a health-check with the `details` flag to get more details about the INTERFACE status.
---
- name: Perform interfaces health checks with more details
 hosts: iosxr
 gather_facts: false
 tasks:
 - name: INTERFACES Manager
   ansible.builtin.include_role:
     name: network.interfaces.run
   vars:
     operations:
       - name: health_check
         vars:
           details: True
           checks:
             - name: all_operational_state_up
Execute the Ansible Playbook with the ansible-navigator:
$ ansible-navigator run example.yaml
Here is the provided result:
ok: [10.0.150.115] => {
    "failed_when_result": false,
    "health_checks": {
        "all_operational_state_up": {
            "check_status": "successful",
            "interfaces_status_summery": {
                "admin_down": 0,
                "admin_up": 5,
                "down": 0,
                "total": 5,
                "up": 5
            }
        },
        "detailed_interface_status_summery": {
            "interfaces": {
                "GigabitEthernet0/0/0/0": {
                    "admin": "up",
                    "name": "GigabitEthernet0/0/0/0",
                    "operational": "up,"
                },
                "GigabitEthernet0/0/0/1": {
                    "admin": "up",
                    "name": "GigabitEthernet0/0/0/1",
                    "operational": "up,"
                },
                "GigabitEthernet0/0/0/2": {
                    "admin": "up",
                    "name": "GigabitEthernet0/0/0/2",
                    "operational": "up,"
                },
                "MgmtEth0/RP0/CPU0/0": {
                    "admin": "up",
                    "name": "MgmtEth0/RP0/CPU0/0",
                    "operational": "up,"
                },
                "Null0": {
                    "admin": "up",
                    "name": "Null0",
                    "operational": "up,"
                }
            }
        },
        "status": "successful"
    }
}
Here we have detailed interface status attributes, like name of the interface, admin and operational state.
We can also perform a health-check with the `ignore_errors` flag to ignore unsuccessful results of check_status.
---
- name: Perform interfaces health checks with ignore_errors
 hosts: iosxr
 gather_facts: false
 tasks:
 - name: INTERFACES Manager
   ansible.builtin.include_role:
     name: network.interfaces.run
   vars:
     operations:
       - name: health_check
         vars:
           details: False
           checks:
             - name: min_admin_state_up
               min_count: 2
               ignore_errors: true
Execute the Ansible Playbook with the ansible-navigator:
$ ansible-navigator run example.yaml
Here is the provided result:
 ok: [10.0.150.115] => {
    "failed_when_result": false,
    "health_checks": {
        "min_admin_state_up": {
            "check_status": "unsuccessful",
            "interfaces_status_summery": {
                "admin_down": 4,
                "admin_up": 1,
                "down": 0,
                "total": 5,
                "up": 5
            }
        },
        "status": "successful"
    }
}
Here though, check_status is unsuccessful; the task did not fail, as we have set ignore_errors to true.
Takeaways & Next Steps
As shown above, with the help of the network.interfaces validated content, we can enhance the experience of resource module consumption by providing production-ready content. By using the persist, gather, detect, remediate and deploy operations, network engineers can gain more flexibility and adopt automation for network interfaces across their environment. We can also perform health checks on interfaces admin and operational state with the health_check operation.
If you want to learn more about Ansible Automation Platform and network automation, you can check out these resources:
- Learn about network.base validated content collection
- Learn about network.bgp validated content collection
- Network Automation Guide
- Network automation self-paced labs
- Automate your Network Instructional ebook
- Network Automation web page
![]()
Originally posted on Ansible Blog
Author: Ashwini Mhatre